DesignBoard
The dynamic behaviour can’t be extracted from the code; one has to run it. Often this is done by manually following the most important functions. (So, not by executing it – that gives way to many details).
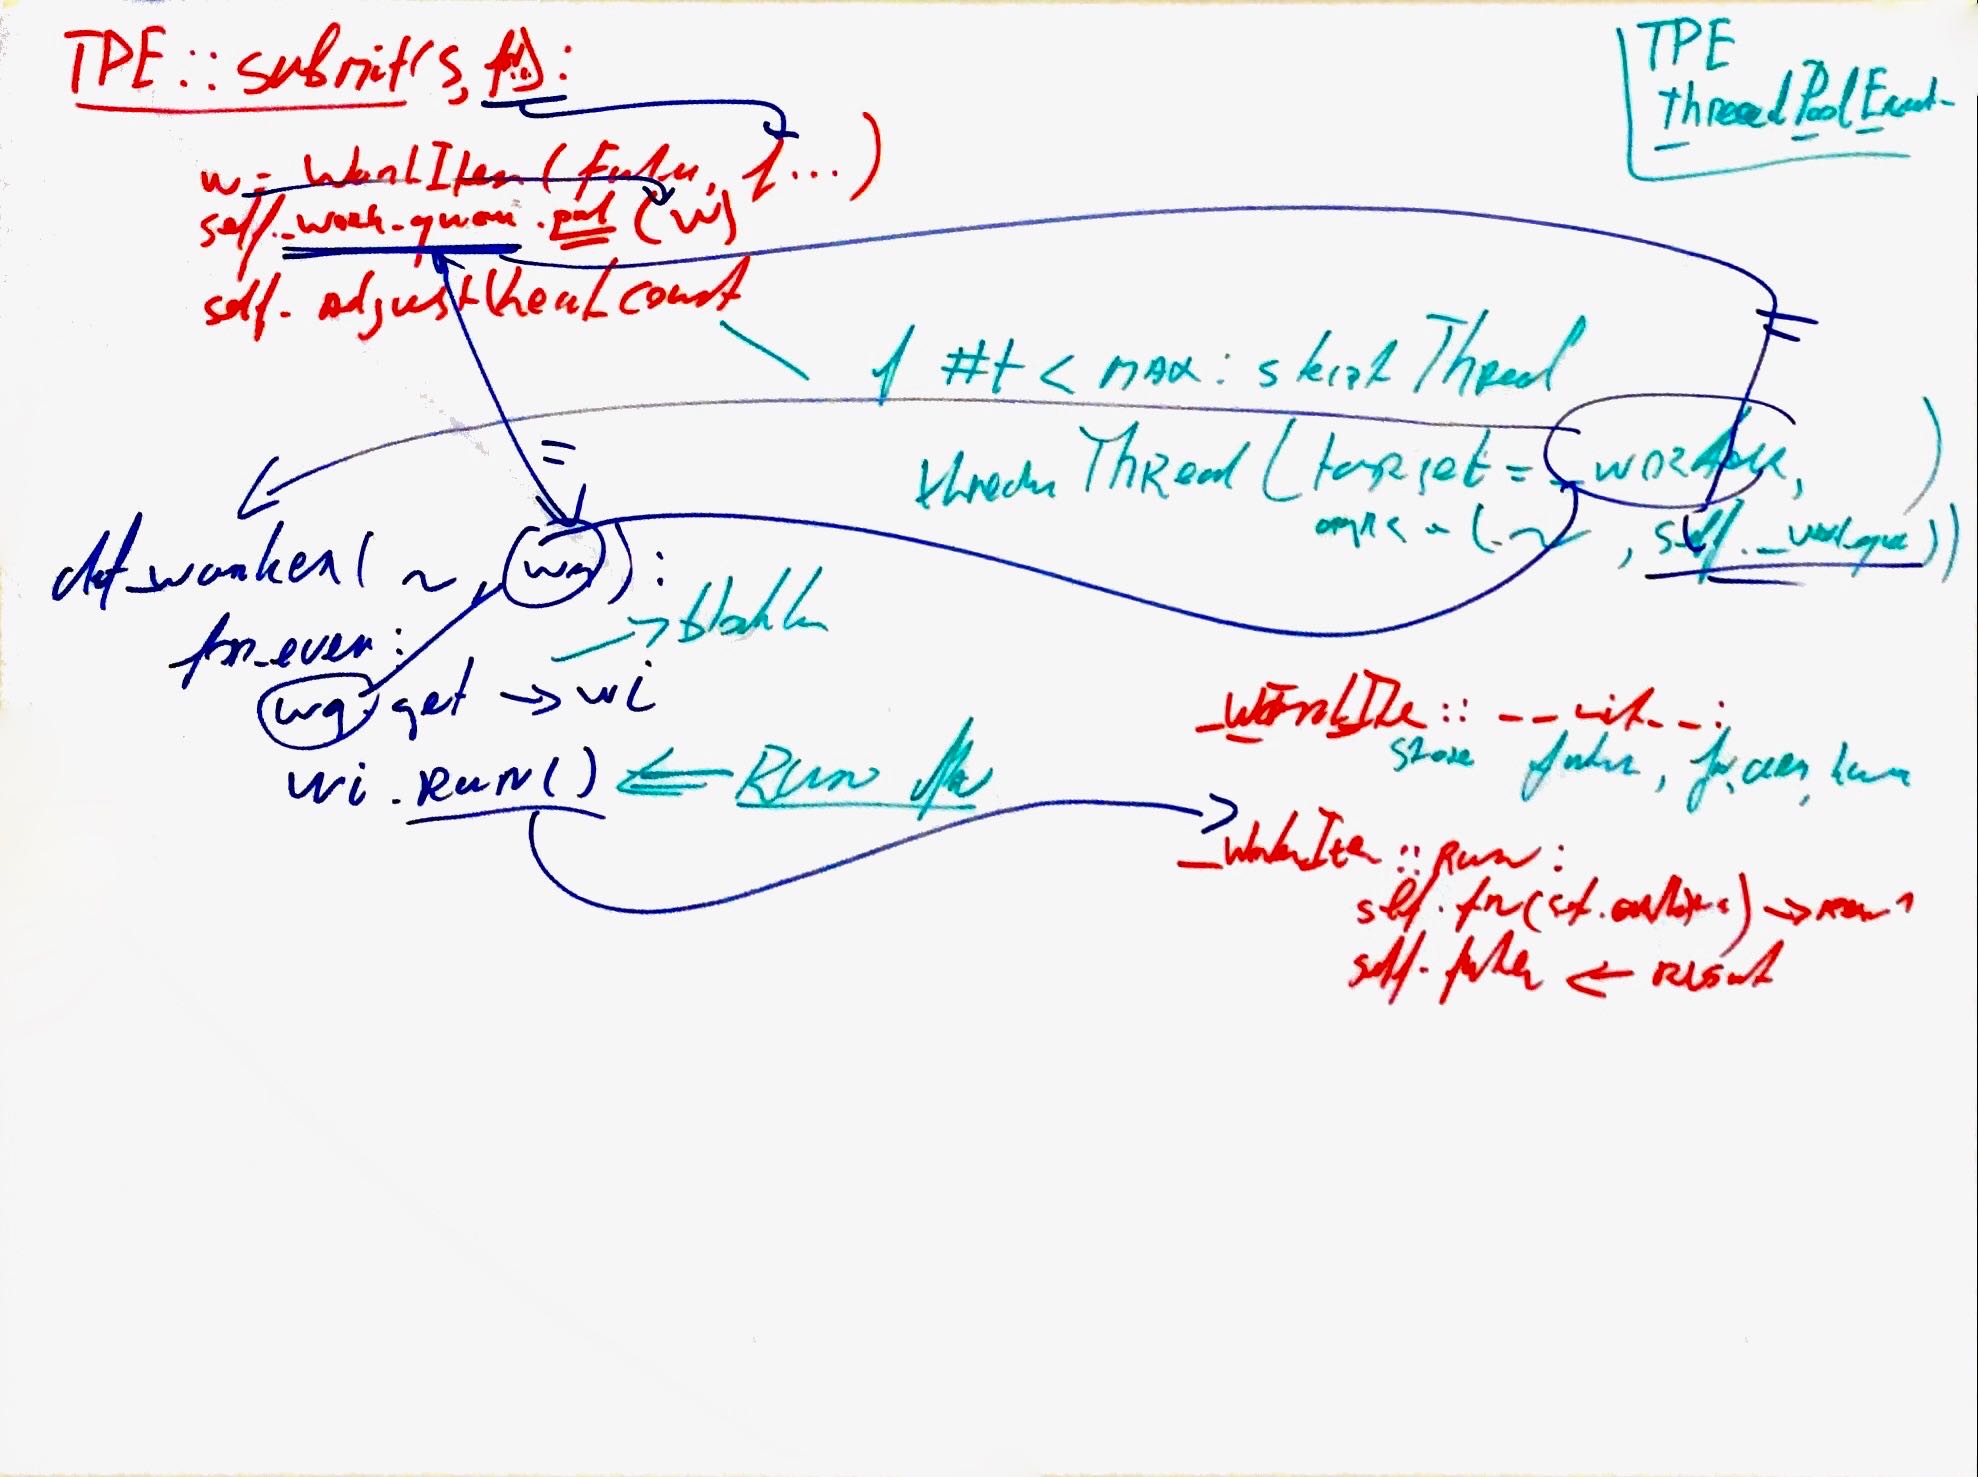
A very convenient procedure is to write-down the essential lines of the method. And of the methods that are being
called. Use “arrows” to denote the (data & control) flow and to connect the pieces. Elaborate when needed.
By using a big whiteboard and many colors (and a wiper!) the “flow” can be visualised.
See my analyse in this picture below.
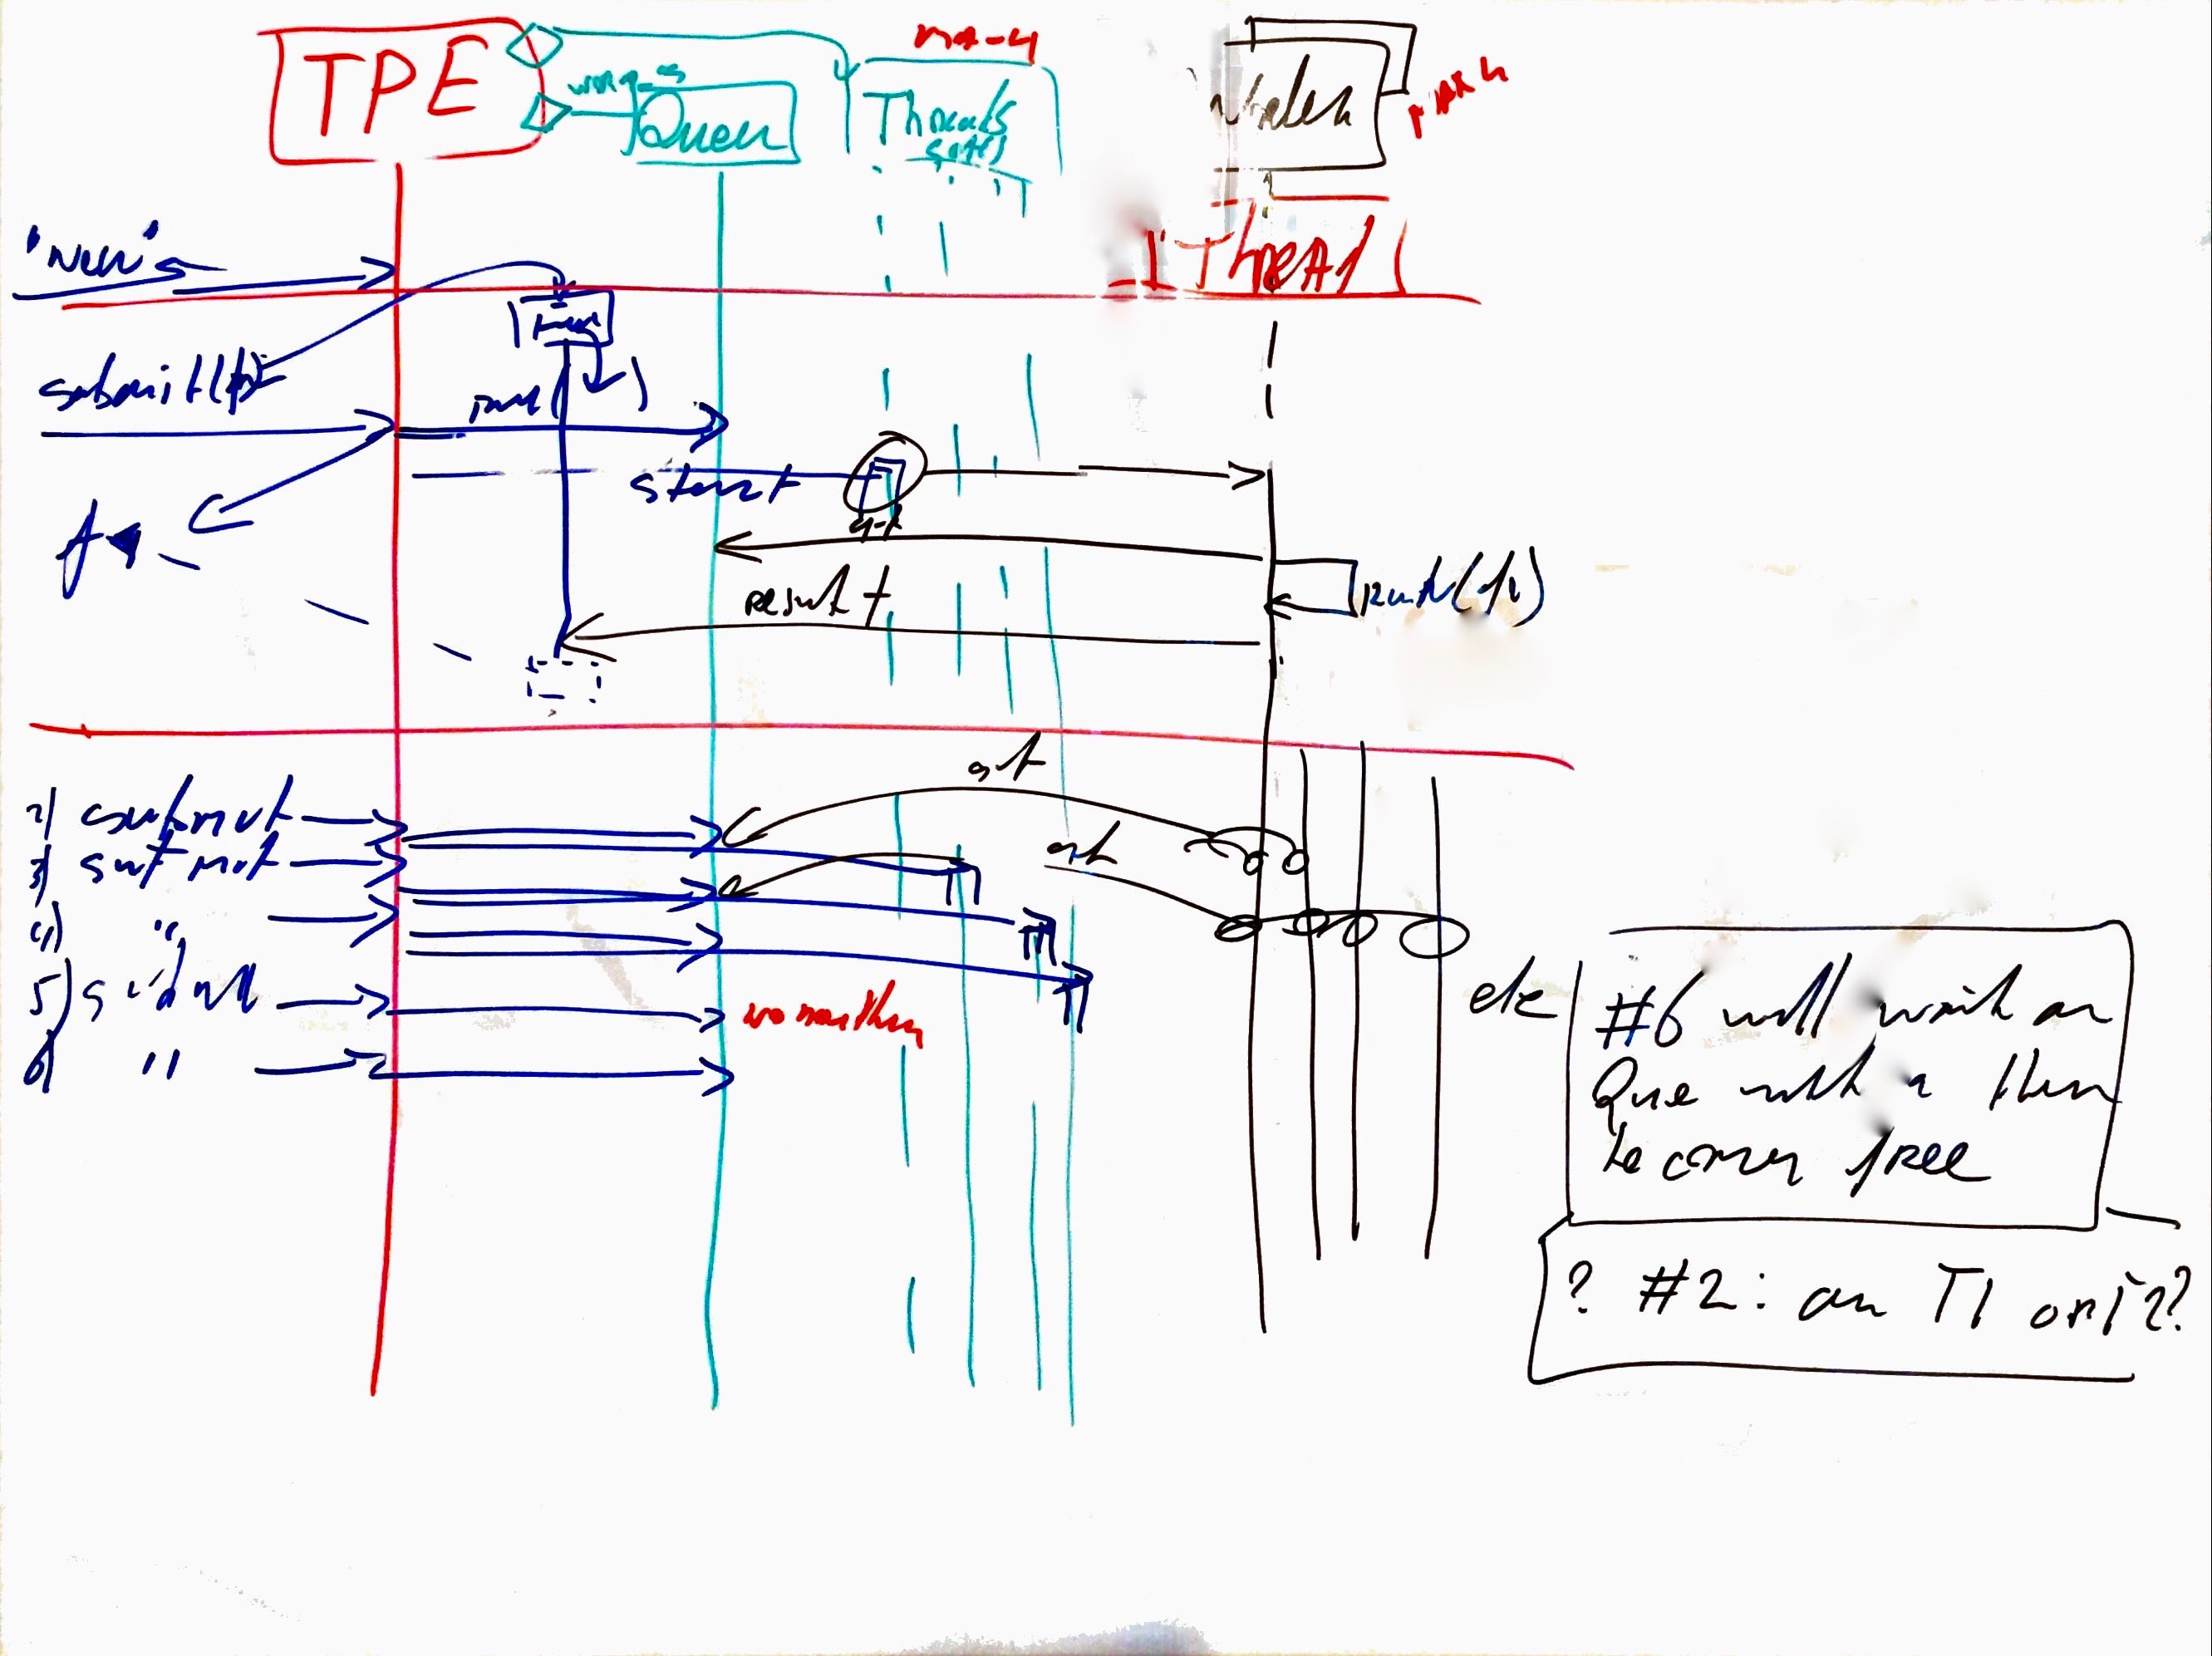
Next, this “curly flow” can be converted to a sequence-diagram. Preferable on a 2nd whiteboard. As shown below.
Last, and optional, we can convert it to (plant)UML:
